
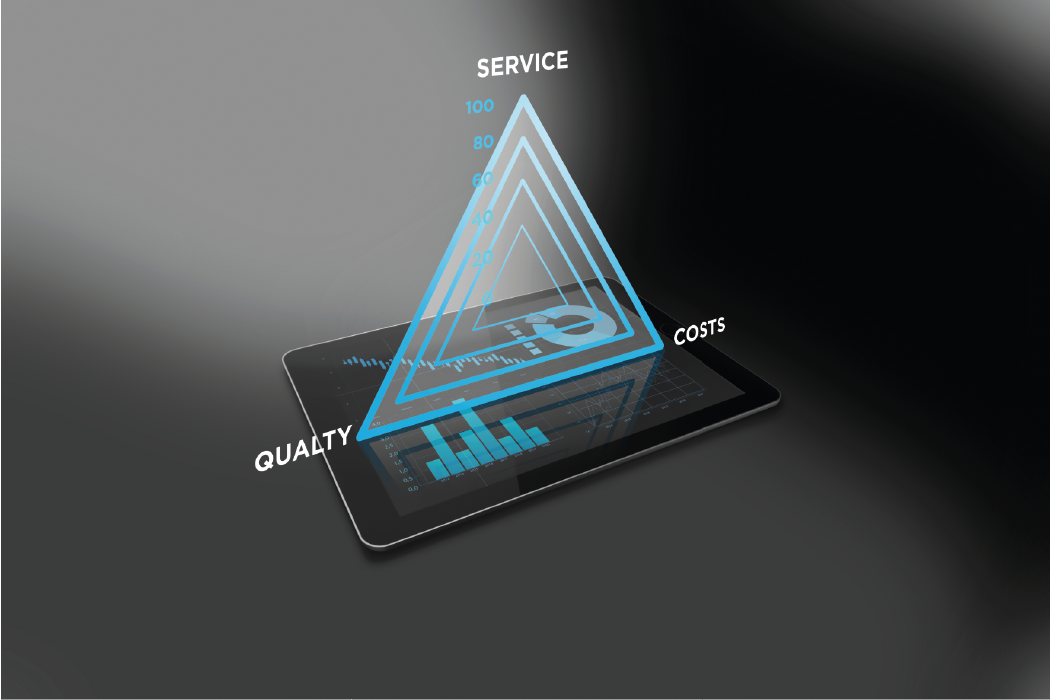
Modern-day management of an optical laboratory is based on three principles: service, quality and costs. These three principles are interlinked – any change in one will affect the other two: a significant reduction in costs will affect quality, thereby impacting on service or delivery times. If quality is low, costs increase and quality of service dips. If quality is increased, service improves and so on.
Laboratories must always be looking to strike a balance between these three pillars to make their business as profitable as possible while achieving client satisfaction.
In the current climate, businesses must prioritize resuming activity while guaranteeing worker safety, as lenses cannot be manufactured remotely. In times of crisis, it is all the more important to make best use of available resources to maximize profitability.
The importance of indicators
Indicators are vital for knowing what is really going on in laboratories and taking appropriate action. In the words of the mathematician and physicist Lord Kelvin (1824-1907), “If you cannot measure it, you cannot improve it.”
In contemporary society, concepts such as data mining or Big Data are becoming increasingly relevant. Current systems allow us to store virtually unlimited quantities of data, but without the right ‘post-production’, ‘raw’ data is of little use. Correct processing and visualizing are required to carry out analysis, identifying patterns and trends that enable us to make the right decisions.
There are three key indicators that must features on the ‘dashboard’ of any laboratory: service, quality and costs.
Service
Service (which, for an optical laboratory, translates into delivery time) is defined as the time that elapses between an order being placed and that order being delivered to the client (in this case, the optician). This is measured in days or hours, and every effort should be made to keep this to a minimum as the end client wants their glasses with the shortest possible delay.
Even more important than speed, however, is that the delivery date matches that given to the client, and that this is as reliable as possible. Opticians prefer to know when their order will be delivered and for this delivery date to be met rather than have uncertainty over many days it will take. The optician, in turn, has to give the end client a delivery time and there is nothing more frustrating than receiving a call to inform you that your delivery will be later than expected or, worse still, a product simply not arriving on time.
Clients should be aware of the various levels of service and different options available: cutting, cutting+coating, cutting+coating+AR, with assembly being added to these three options.
Any laboratory’s day-to-day running must include following up and managing orders that have not been delivered on time. As part of this process, these orders should be prioritized and the delay should be analyzed by technical staff.
The final stage of the turnaround time is generally subcontracted to a logistics company. A laboratory loses control over an order from the moment it leaves its doors, so delivery times must be agreed with the delivery company along with a system for monitoring dispatches at every stage in their journey.
Quality plays a fundamental role in service, as improved quality will automatically improve service.
It is possible to predict the number of attempts needed to complete manufacturing orders to an acceptable quality, as demonstrated by Dr. Xavier Fernández (PhD Machine Vision) in 2009.
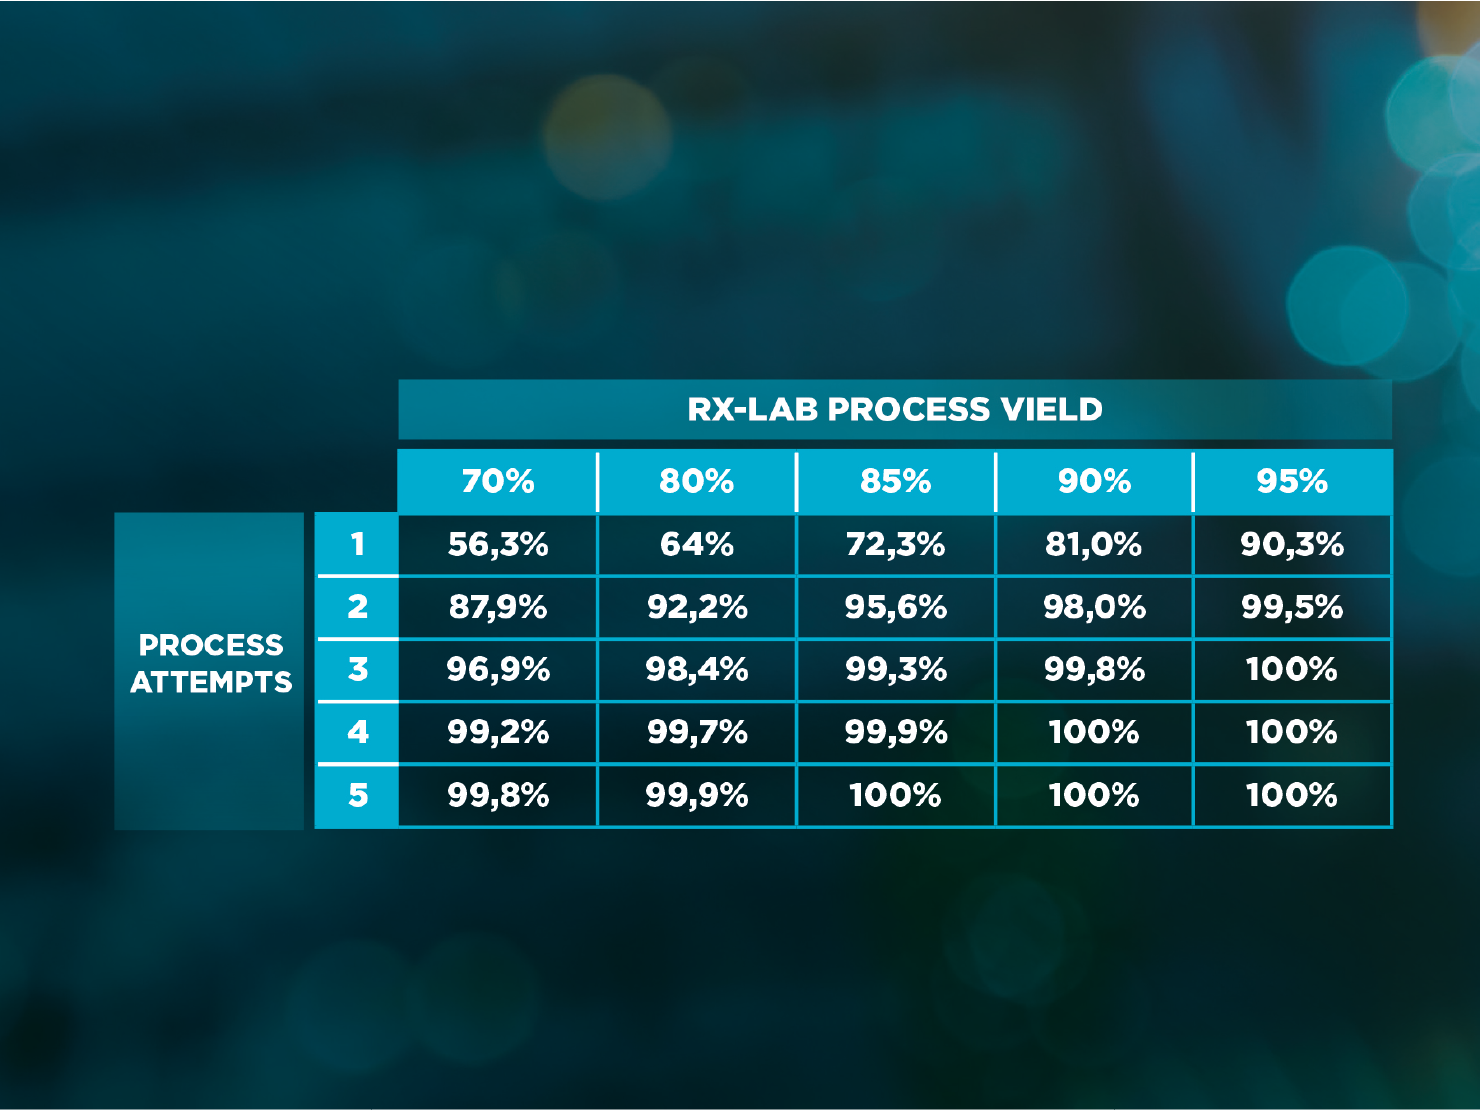
Table: Fraction of Finished Orders after each Process Attempt
This table compares the quality of a laboratory with the number of attempts needed to complete orders placed. For example, for 95% yield (the percentage of quality lenses after a final inspection) a maximum of three attempts are needed to complete all orders. However, for 70% yield more than five attempts may be required in some cases, which will have a knock-on effect causing delays and additional costs.
Quality
For laboratories, quality is determined by how many lenses pass various inspections. In other words, out of every 100 lenses processed, how many are completed with no errors.
Having a metric to measure quality is essential for taking appropriate action. A laboratory’s overall quality can be calculated by multiplying the quality obtained at each stage of production: cutting, treatments and assembly.
Quality control systems must be linked to a database where errors detected are entered with as much detail as possible. Statistical analysis of this database will identify areas for improvement.
Good quality cannot be achieved without investment, whether this is in training, machinery, consumables or quality lens design. Implementing quality control in line with ISO or ANSI standards (depending on the market) will help to maintain sufficient production controls.
Human error is a factor that must always be taken into consideration. This can be addressed through training, Poka-yoke and automation.
Training
Training is essential for getting good results. To correctly train laboratory staff, all processes must first be documented in detail so that any new staff can be given a workplace ‘manual.
Poka-yoke
Poka-yoke (Japanese for ‘mistake proofing’) is a tool aimed at avoiding errors. A clear example of Poka-yoke in an optical laboratory can be found in the job trays. A slot in the metal alloy block (or, more recently, plastic) and a screw in the job tray ensures lenses are placed in the desired position, and eliminates the possibility for rotation errors.
Power deviations
In FreeForm manufacturing, the final power depends greatly on the value of the semi-finished base used. How exact this information is will affect all lenses that use this particular semi-finished variant. The value of the base is a piece of information that the semi-finished supplier should provide, and always has a degree of variability. To minimize the impact of this variability, it is a good idea to gather statistics from all lens measurements taken at the end of the process. This will allow for adjustment of the bases of each variant according to results obtained.
By analyzing the deviation data obtained with histograms or median deviation it is possible to calculate the optimum configuration value for each base, to achieve a maximum number of lenses for which the power falls within the manufacturing tolerance.
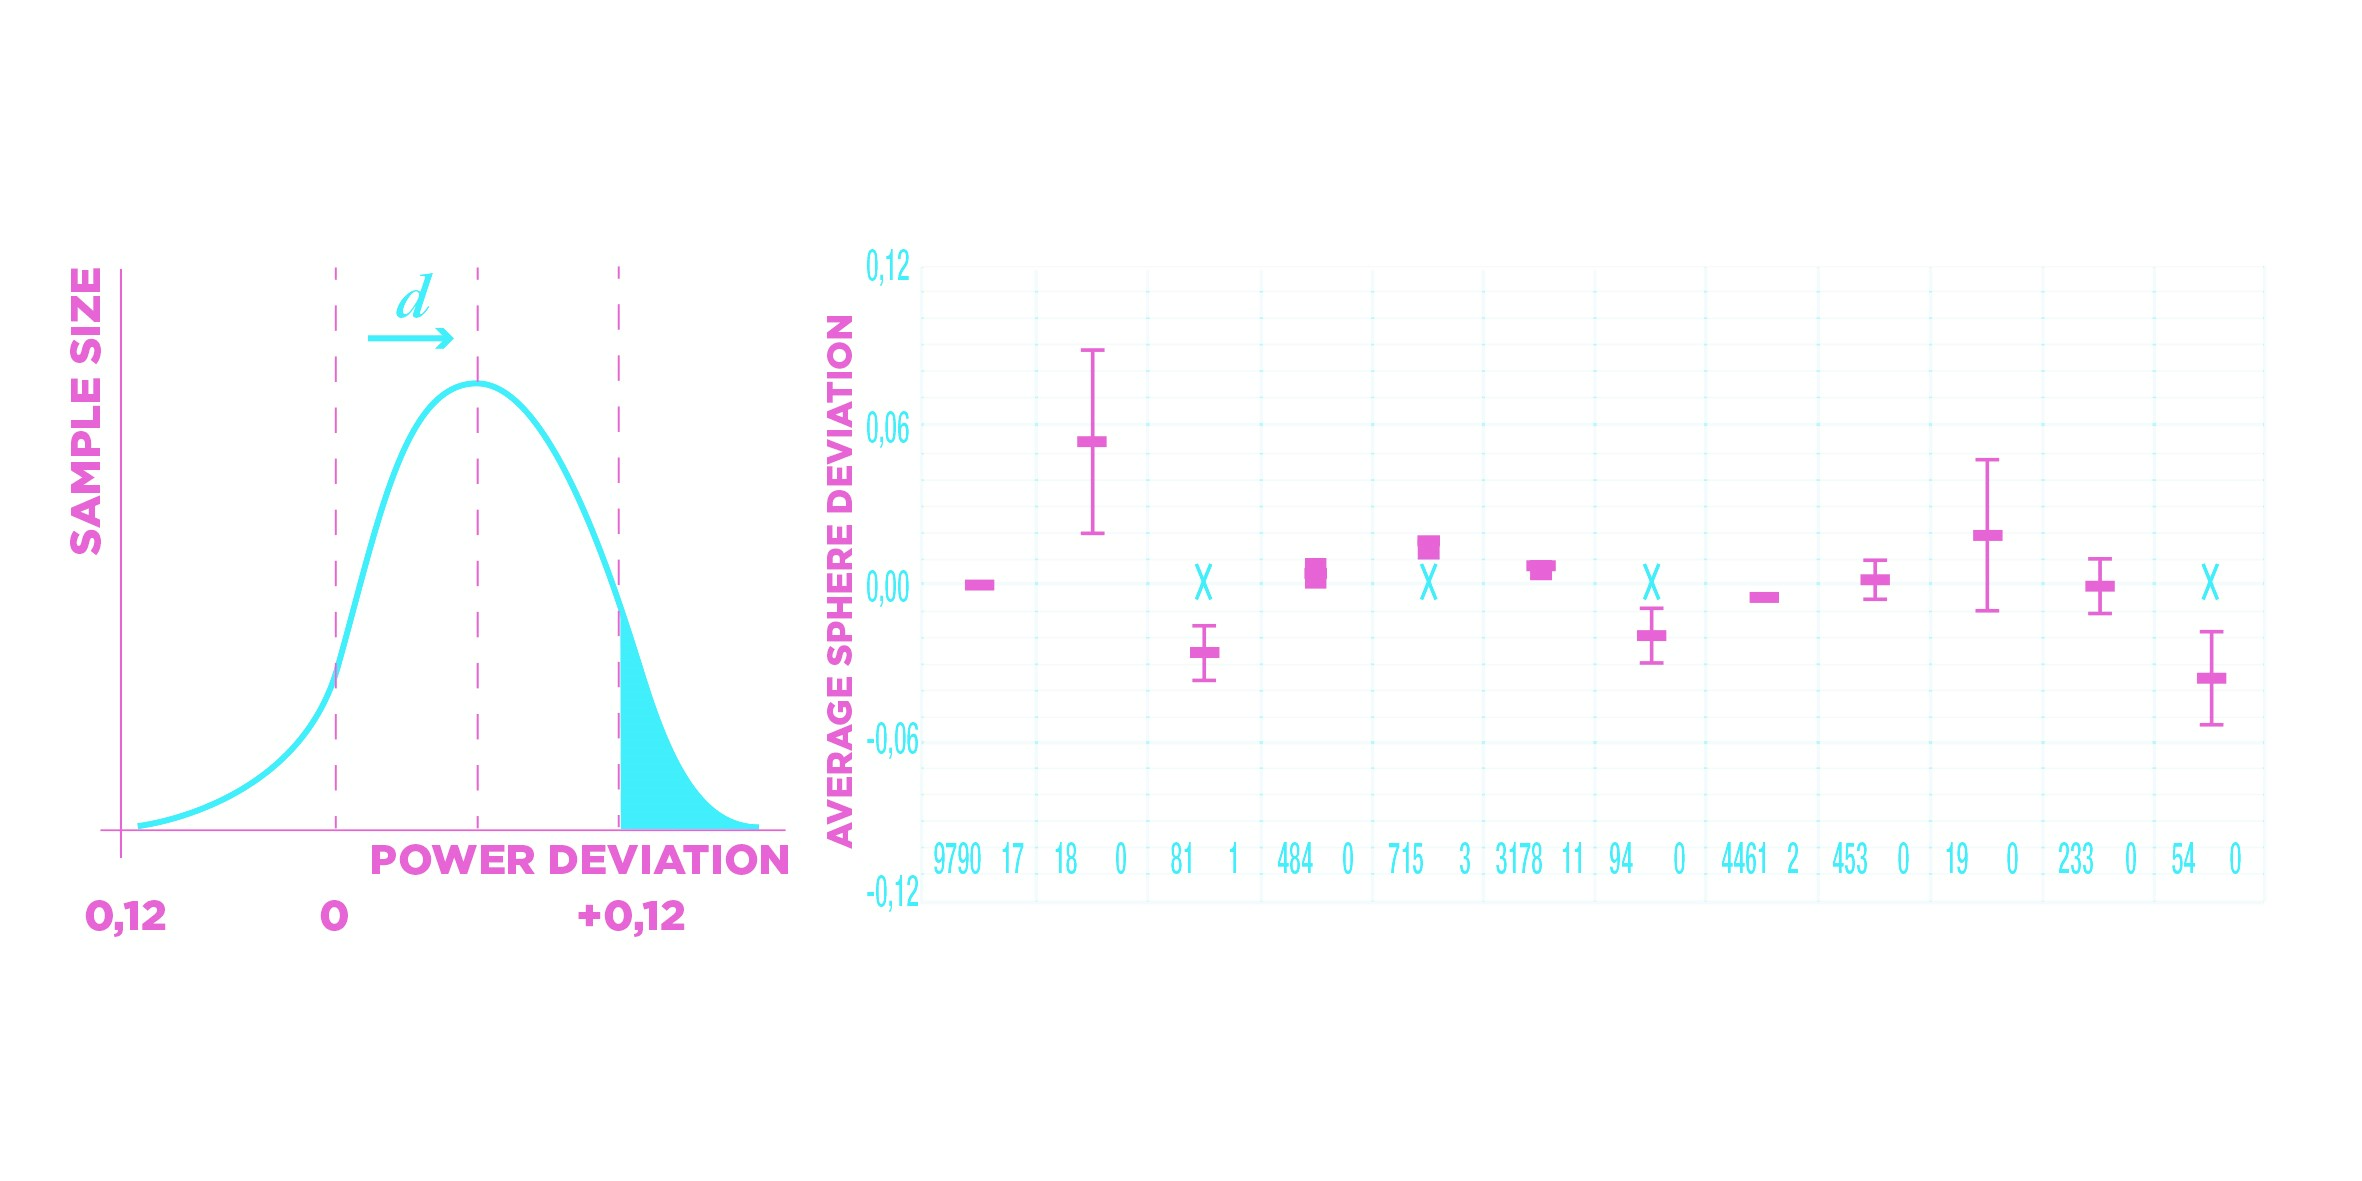
Graph: Power deviation
In this example we have a bell curve with some deviation. By correcting this it can be centered so that more lenses fall within the tolerance.
Costs
Costs, here, refer to the costs of production. These include consumables used, energy costs, human resources, etc.
The indicator for human resources must take into account the cost of absenteeism, as well as the real and theoretical workforce. This will help to ensure the workforce is accurately sized according to company requirements.
The cost associated with purchasing machinery must be set aside as investment, as it will affect the cost of various activities until it is paid off.
One of the most important tasks for production control is managing spending on consumables. The most commonly used metric is BOM (Bill of Materials). This can be thought of as an ingredients list for each piece manufactured, where each lens is assigned a percentage of consumables used. This means the cost of each product can be calculated in terms of materials consumed, thereby working out the profit made on each piece sold. The BOM should be regularly updated with new costs.
Another factor to take into consideration is the cost of poor quality. Defective lenses that cannot be dispatched to the client and are scrapped have a significant associated cost that must be calculated to assess whether it would be more profitable to make investments that would lead to improved quality.
Other indicators
We have looked at three key indicators, but there are others that are equally important. We will take a look at these below.
Maintenance
Maintenance can be included under costs, and has its own associated indicators. The maintenance department plays a crucial role in a laboratory’s organization. Almost all manufacturing processes heavily depend on the maintenance department doing its job of installation, preventive maintenance, adjusting equipment, etc.
There is a constant conflict of interest between production and maintenance. Production do not want to stop machines, aiming to process the maximum number of lenses in the smallest amount of time, whereas maintenance needs machines to stop to carry out relevant preventive tasks.
It is important to understand that preventive maintenance of machinery is a future investment. Think of it like a car: if maintenance work is not done, the car will not need to be left with the mechanic and out of use for a few hours or days. However this does increase our risk of a serious breakdown when we are least expecting it.
This is why preventive work must be carried out. It should be planned for a quiet period when it will have the least impact on production, but it must not be avoided altogether. The benefit of carrying it out is greater than the saving in terms of machine time.
The most commonly-used methodology for maintenance management is TPM.
TPM
TPM stands for ‘Total Productive Maintenance’, and is a maintenance philosophy that originated in Japan. The goal is to eliminate losses in production through stoppages. It is based on eight pillars: improvement, autonomous maintenance, planned maintenance, employee training, early management, quality improvement, TPM across departments and environmental conditions.
The TPM philosophy aims for excellence in maintenance to eliminate the unexpected. There is a wide range of TPM management software available that can help with correct planning.
There is another indicator that helps to improve how effective equipment is overall: OEE.
OEE
OEE stands for ‘Overall Equipment Effectiveness’. This indicator gives a percentage value that indicates how effective a laboratory is, making it one of the most important indicators for any laboratory. This indicator links availability, performance, and quality.
Availability
When it comes to machines, as you might expect, availability is the percentage of time that the machine is productive. Any stoppages need to be deducted.
Performance
Performance is the ability to produce something with the means invested. It tells us how effective a process is. In the context of an optical laboratory, it tells us how much has been manufactured compared to how much could have been manufactured.
Let’s illustrate this with an example. For car engines, given the principles of thermodynamics, the performance of gasoline is around 30%, whereas diesel is around 40%. The rest of the energy is lost in the form of heat. With an electric motor, on the other hand (which is not thermal), performance is over 90%.
Luckily, laboratory performance is closer to that of an electric motor than a combustion engine.
In a perfect world, OEE would be 100%. However, reductions in quality, availability or performance bring this indicator down, requiring work to bring it back up.
PDCA
A final indicator that must be considered as part of any improvement plan is the Deming cycle, a continuous improvement methodology also known as the PDCA cycle after the initials for ‘Plan-Do-Check-Act’.
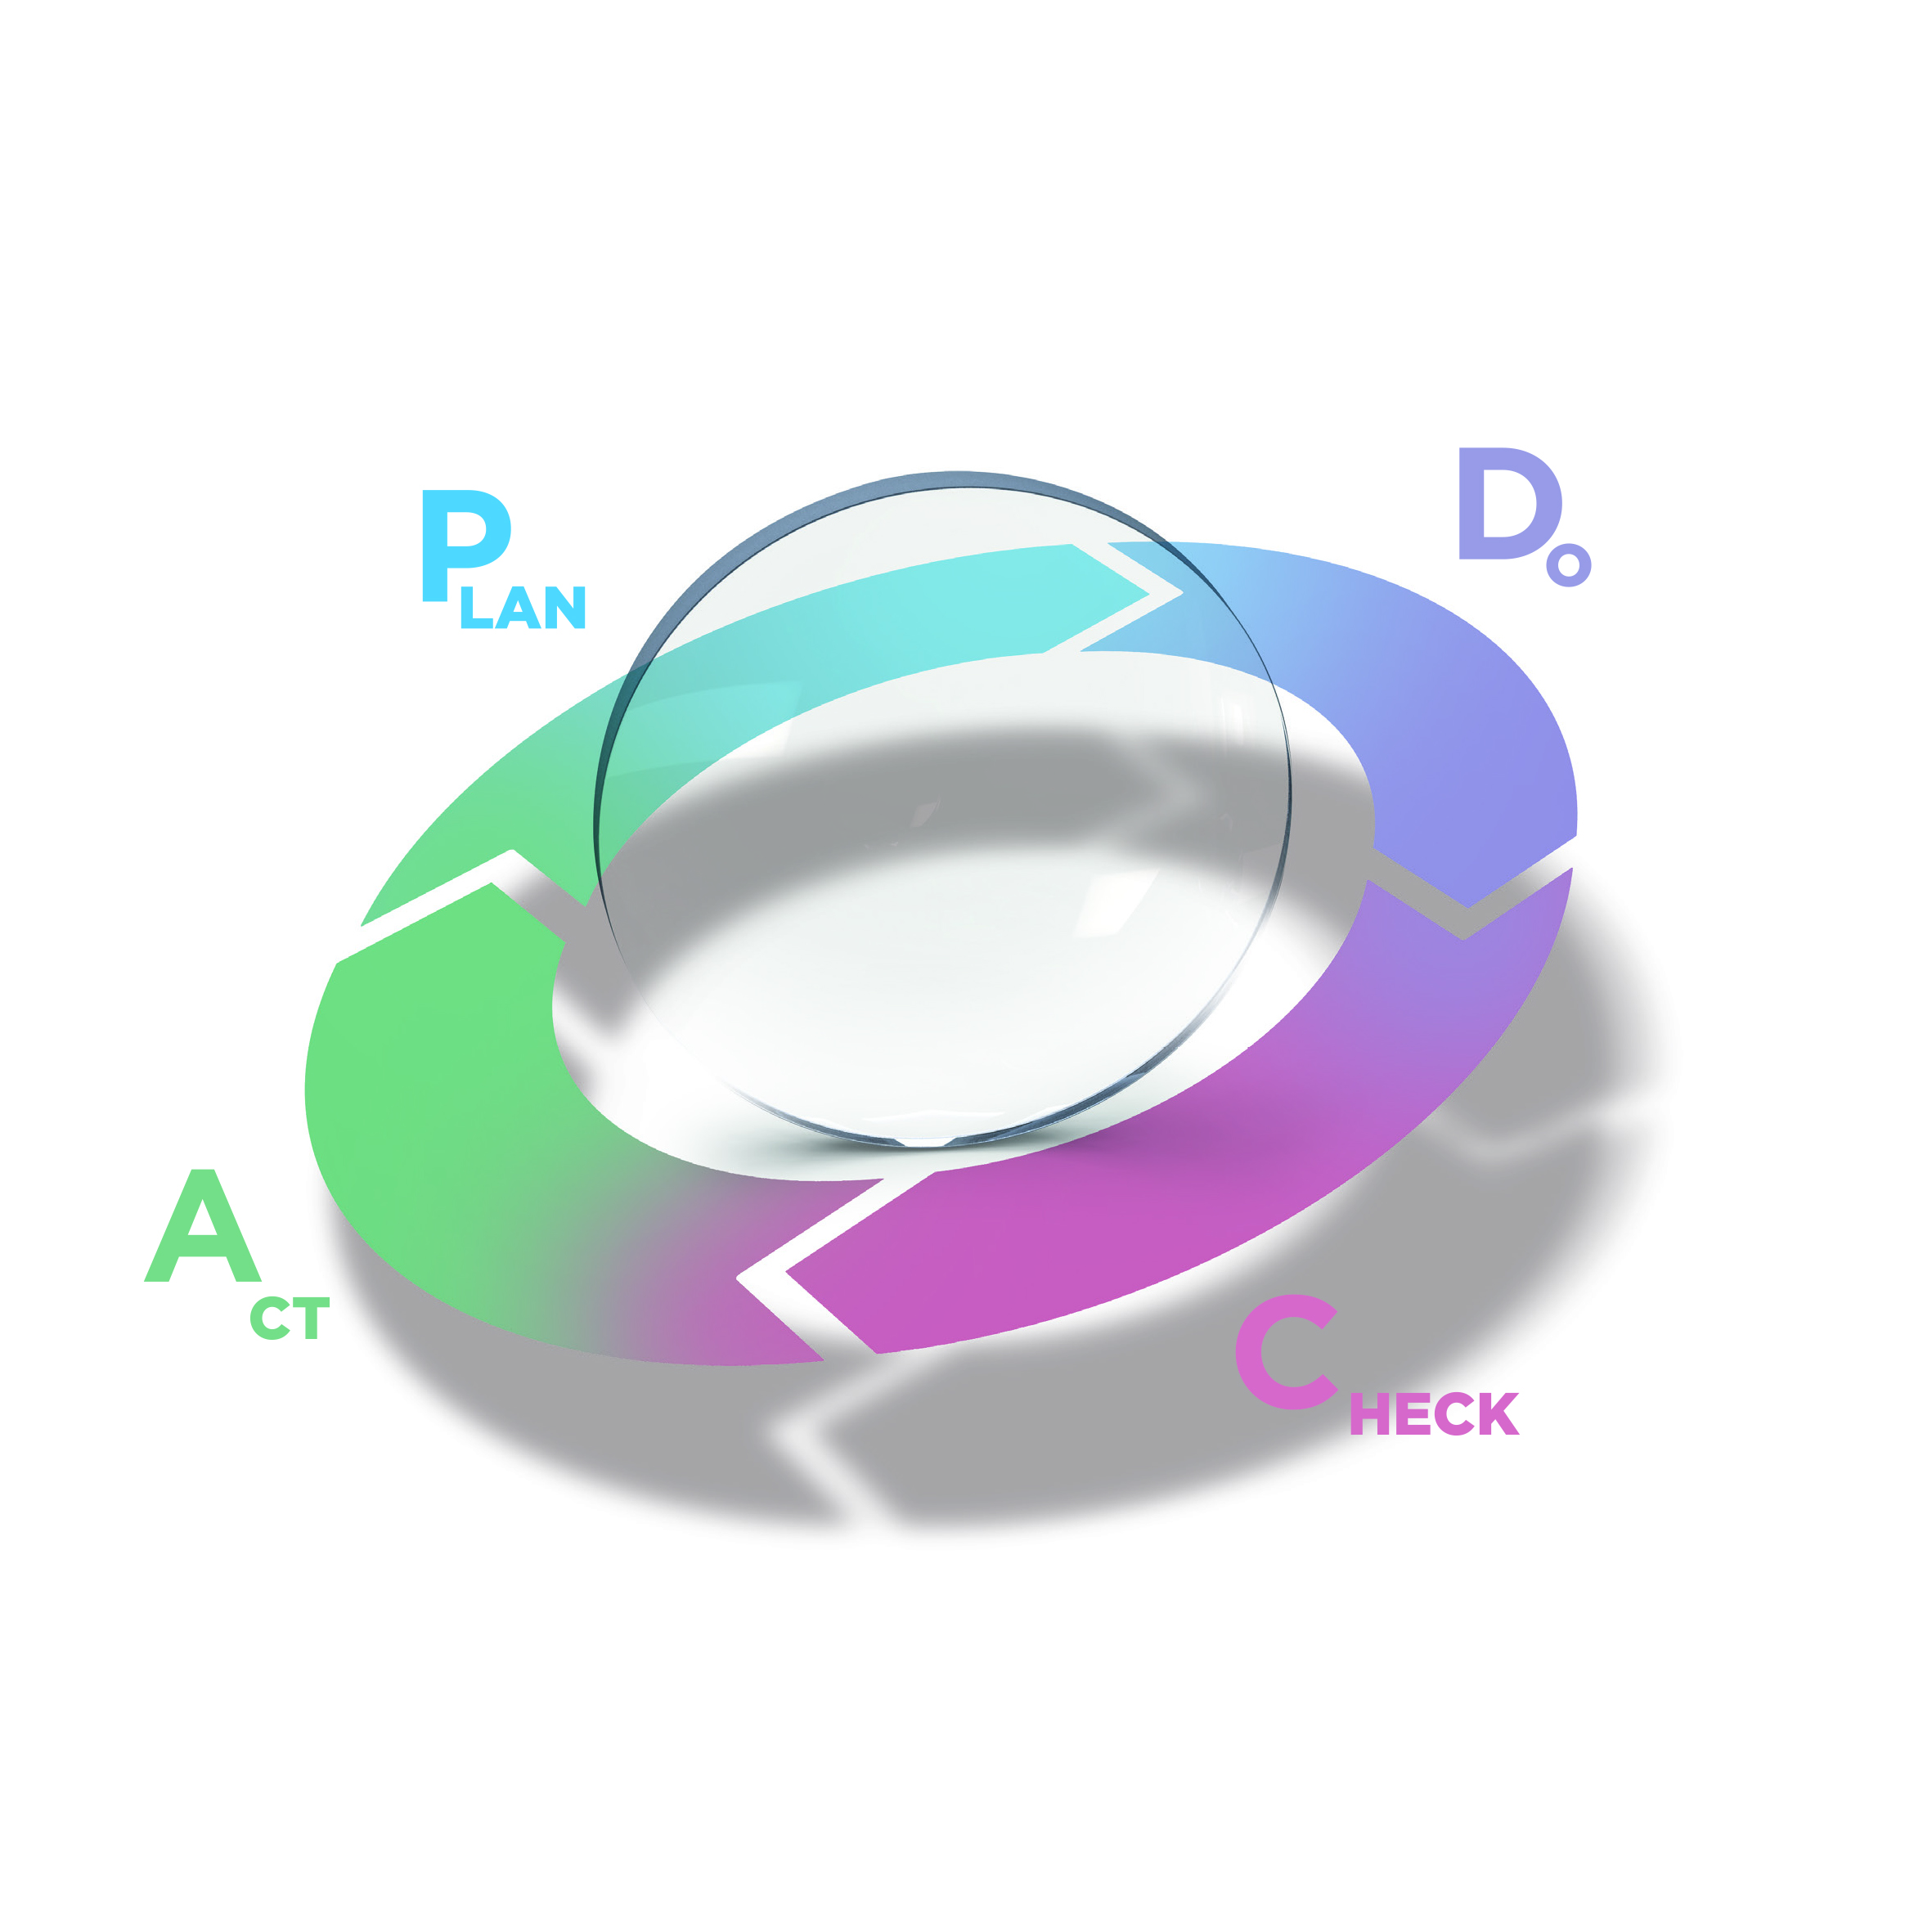
In practice for a laboratory, this translates into a list of tasks, the status of each being marked according to the following descriptions:
PLAN : The task has been created is scheduled for completion.
DO : The task is carried out.
CHECK : The impact of the task is analyzed.
ACT : Depending on the results of the impact analysis it maybe necessary to make adjustments, taking us back to the start of the cycle: Plan.
Conclusion
In our current context of global uncertainty, we need tools that allow us make our laboratories as profitable as possible. We cannot allow for even the slightest reductions in productivity. Indicators are essential for any business, for understanding the current situation and taking action to identify improvements, implementing these improvements and, as a result, improving productivity.
Bibliography
Performance: https://www.diariomotor.com/tecmovia/2012/10/02/los-limites-de-la-eficiencia-termica-en-motores-gasolina-y-diesel/
ISO 9001 quality certification: https://www.aenor.com/certificacion/calidad/iso-9001
American National Standards Institute (ANSI) https://www.ansi.org/
TPM: http://www.mantenimientopetroquimica.com/tpm.html
Article published in Optical World magazine, October 2020